 FROM UNSUSTAINABLE TO SUSTAINABLE DEVELOPMENT
 FROM UNSUSTAINABLE TO SUSTAINABLE DEVELOPMENT
Introduction
1. Method : Commenting on a line graph
Stage 1: introduction - Presenting the document
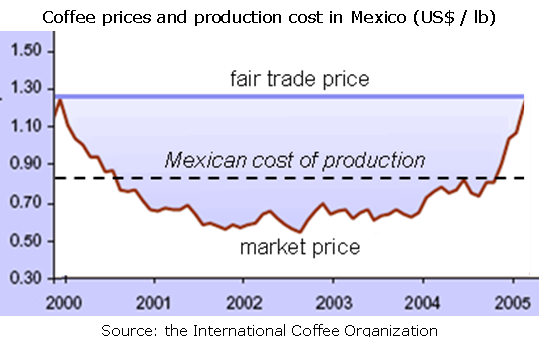
Rephrase references (type, title, author, source, publication date and place) : This graph from the International Coffee Organization compares the evolution of fair trade and market coffee prices with its cost of production from 2000 to 2005,
Give context (scale of the document, type of country mentioned): on a national scale, in Mexico an emerging country (BRICSAM).
Stage 2: Analysing the document
| Describing a cartoon
- What you see structured (≠ parts) and detailed description |
Interpreting a cartoon
- What you know add & structure the definition of key notions |
1st line: market coffee price Note: price are below production cost, aproximately 0.85, from the end of 2000 to the end of 2005 - 2nd period, 2nd trend: |
Negative aspect: unsustainable farming |
| Positive aspect: sustainable farming Mexican farmers sell at a good price so they have a high income => high standard of living (material comfort) = sustainable developement (see definition in the Notions) Fair trade def: buying and selling goods so that small producers, usually in developing countries, really benefit. |
|
| 2nd line: faire trade coffee price - stable at nearly 1.3 US dollar per pound - higher than production cost at 0.85 US$/lb - higher than market price |
Stage 3: Concluding
Assess doc (reliable/biased justified): This line graph is reliable as it comes form an official source, the international coffee organization, and unbiased because a graph is based on figures. .
Sum-up ideas (+ nuance/opening): To conclude, to sum up, to recap, this graph shows that Mexican farmers’ standard of living is unstable because they depend on world coffee prices. It refers to unsustainable development but the solution could be fair trade coffee which is more sustainable.