 FROM UNSUSTAINABLE TO SUSTAINABLE DEVELOPMENT
 FROM UNSUSTAINABLE TO SUSTAINABLE DEVELOPMENT
Remedial test correction
Commenting on a line graph
Stage 1: Introduction - Presenting the document /2
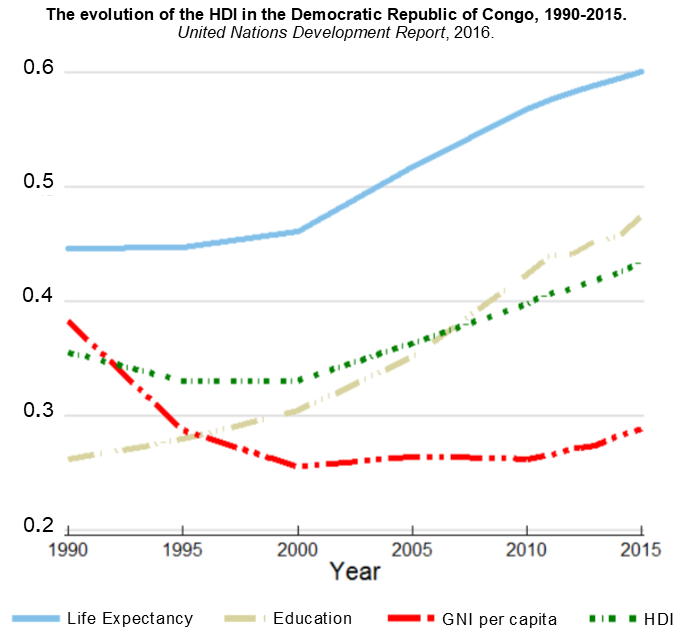
Rephrase references (type, title, author, source, publication date and place) : This line graph from a United Nations Development report published in 2016 shows the evolution of the HDI from 1990 to 2015 in the Democratic Republic of Congo (DRC),
Give context (scale of the document, type of country mentioned): so on a national scale in a developing country.
-Type of doc. /0.5 -References rephrased with proper verbs /0.5 -Context /1
Stage 2: Analysing the document /6
| Describing a line graph
- What you see structured (≠ parts) and detailed description |
Interpreting a line graph
- What you know add & structure the definition of key notions |
2rst line: life expectancy |
Very positive social aspects: |
2nd line: education |
|
3rd line: GNI per capita |
But slightly negative economic aspect: income, wealth decreased /0.5 => low standard of living (= material comfort of a population) /0.5 |
| => 4th line: the HDI The HDI falls a little from around 0.36 in 1990 to nearly 0.33 in 2000 & stabilizes /0.5. Then it rises a lot to 0.42 in 2015 (+ than in 1990) /0.5 |
=> A slightly higher HDI = the Human Development Index /0.5 measures health (line 1), education (line 2) & income (line 3) /0.75 => a little bit more sustainable /0.25 |
Stage 3: Concluding /2
Assess doc (reliable/biased justified): To conclude, this graph is reliable because we have its full references and it is unbiased as it is just figures without the opinion of the author.
Sum-up ideas (+ nuance/opening): To recap, this document shows that human development was very low in the DRC but it increased and became more sustainable, mainly thanks to social improvements.
Assess doc /1 (-Reliable /0.5 -Unbiased /0.5) +
Sum-up ideas /1 (+ and - aspects)