 THE AMERICAN DREAM
 THE AMERICAN DREAM
Introduction
2. Method: Commenting on a bar graph
Stage 1: Presenting the document: the introduction
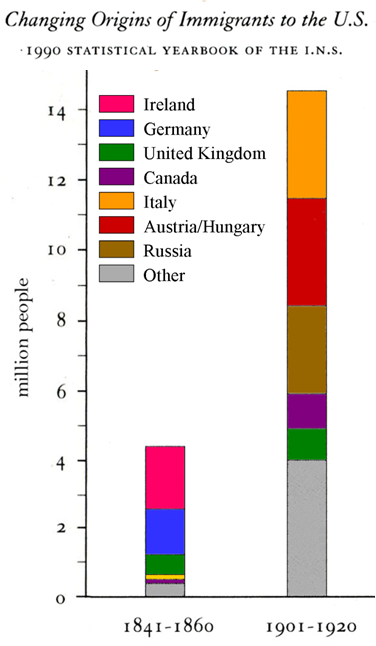
(rephrase references) This bar graph published by the INS in the 1990 statistical Yearbook shows the changing origins of immigrants to the USA between 1841-1860 and 1901-1920, (define main notion) that is to say where immigrants came from before settling in the USA, (give context) in the 19th century at the time of the Industrial Revolution.
Stage 2: Analysing the document
| DESCRIBING A BAR GRAPH - What you see structured (≠ parts) and detailed description |
INTERPRETING A BAR GRAPH - What you know add and structure the definition of key notions |
Flows |
More immigrants •From a small number of immigrants = small immigration • To a large number of immigrants = mass immigration => open borders to facilitate the free movement of people |
| Origins • 1841-1860: nearly 1 million and a half Irish, Germans, approximately half a million British •1901-1920: 2 million Italians, Austrians, Russians = sharp rise, half a million British = drop . . |
More diversity •Immigrants coming from Europe and more precisely from northern and western Europe = old immigration •Immigrants from Europe too but more precisely from southern and eartern Europe = new immigration => a cosmopolitan society, i.e. with many different ethnic communities |
Stage 3: Concluding
To conclude, (assess doc) we can say this document is reliable -as it comes from an official source, and unbiased as it shows mere figures without any interpretation, opinion.
To recap,(sum-up ideas) this bar graph shows the increasing quantity and diversity of immigrants to the USA and so the increasingly cosmopolitan US society. However, these different ethnics communities won’t mix and will form a multicultural society.